The Hand Count
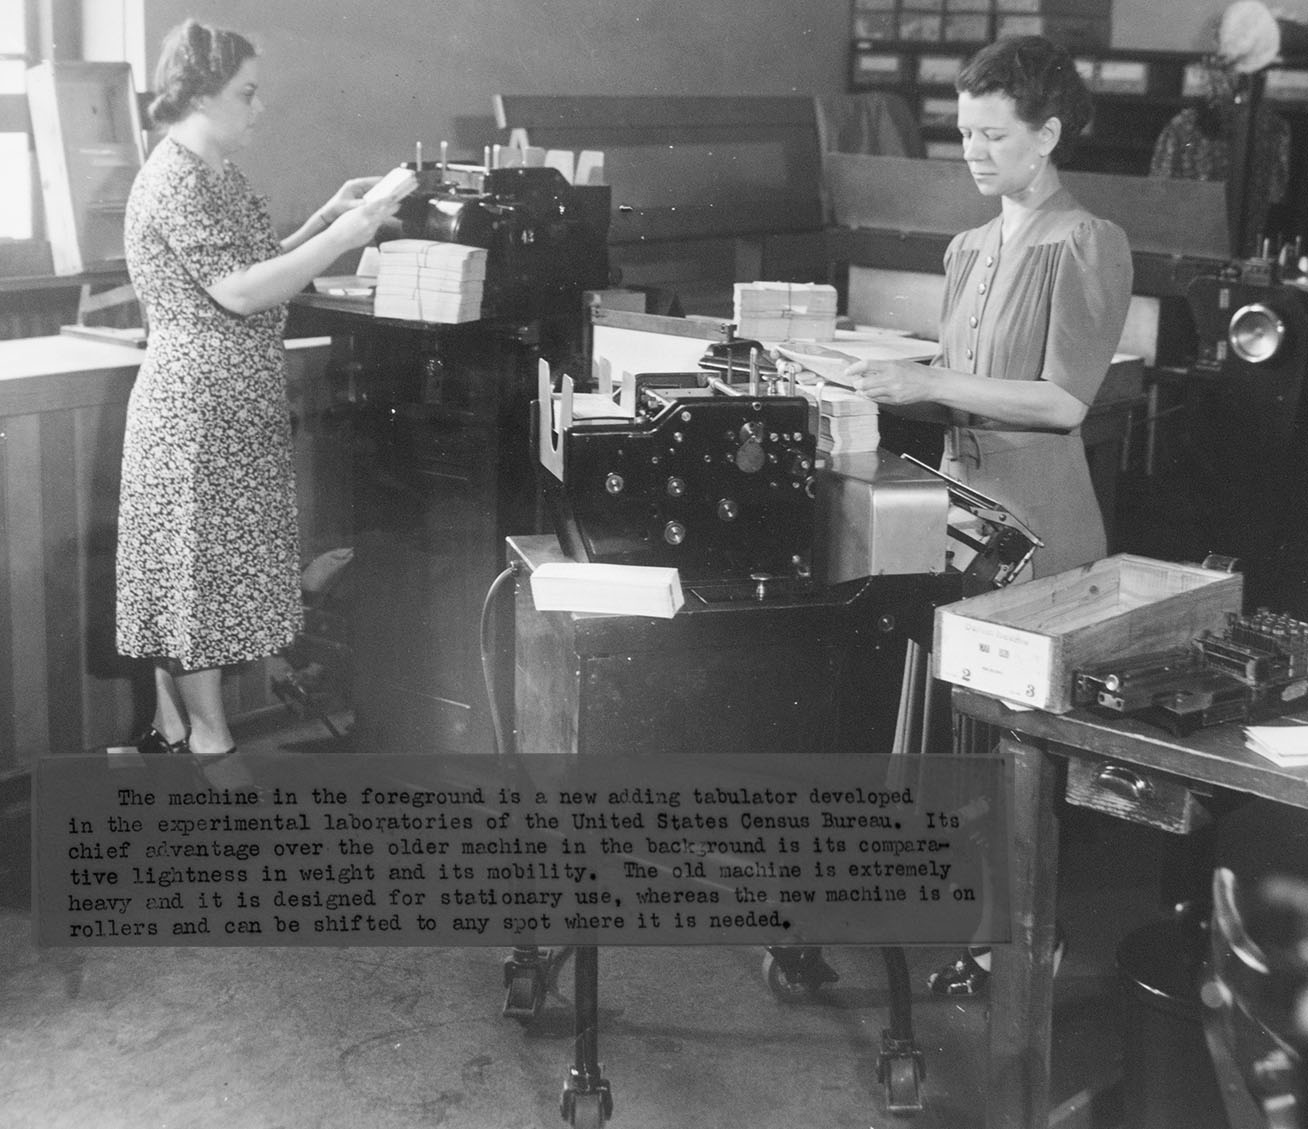
This is what I thought counting the U.S. population looked like in 1940.
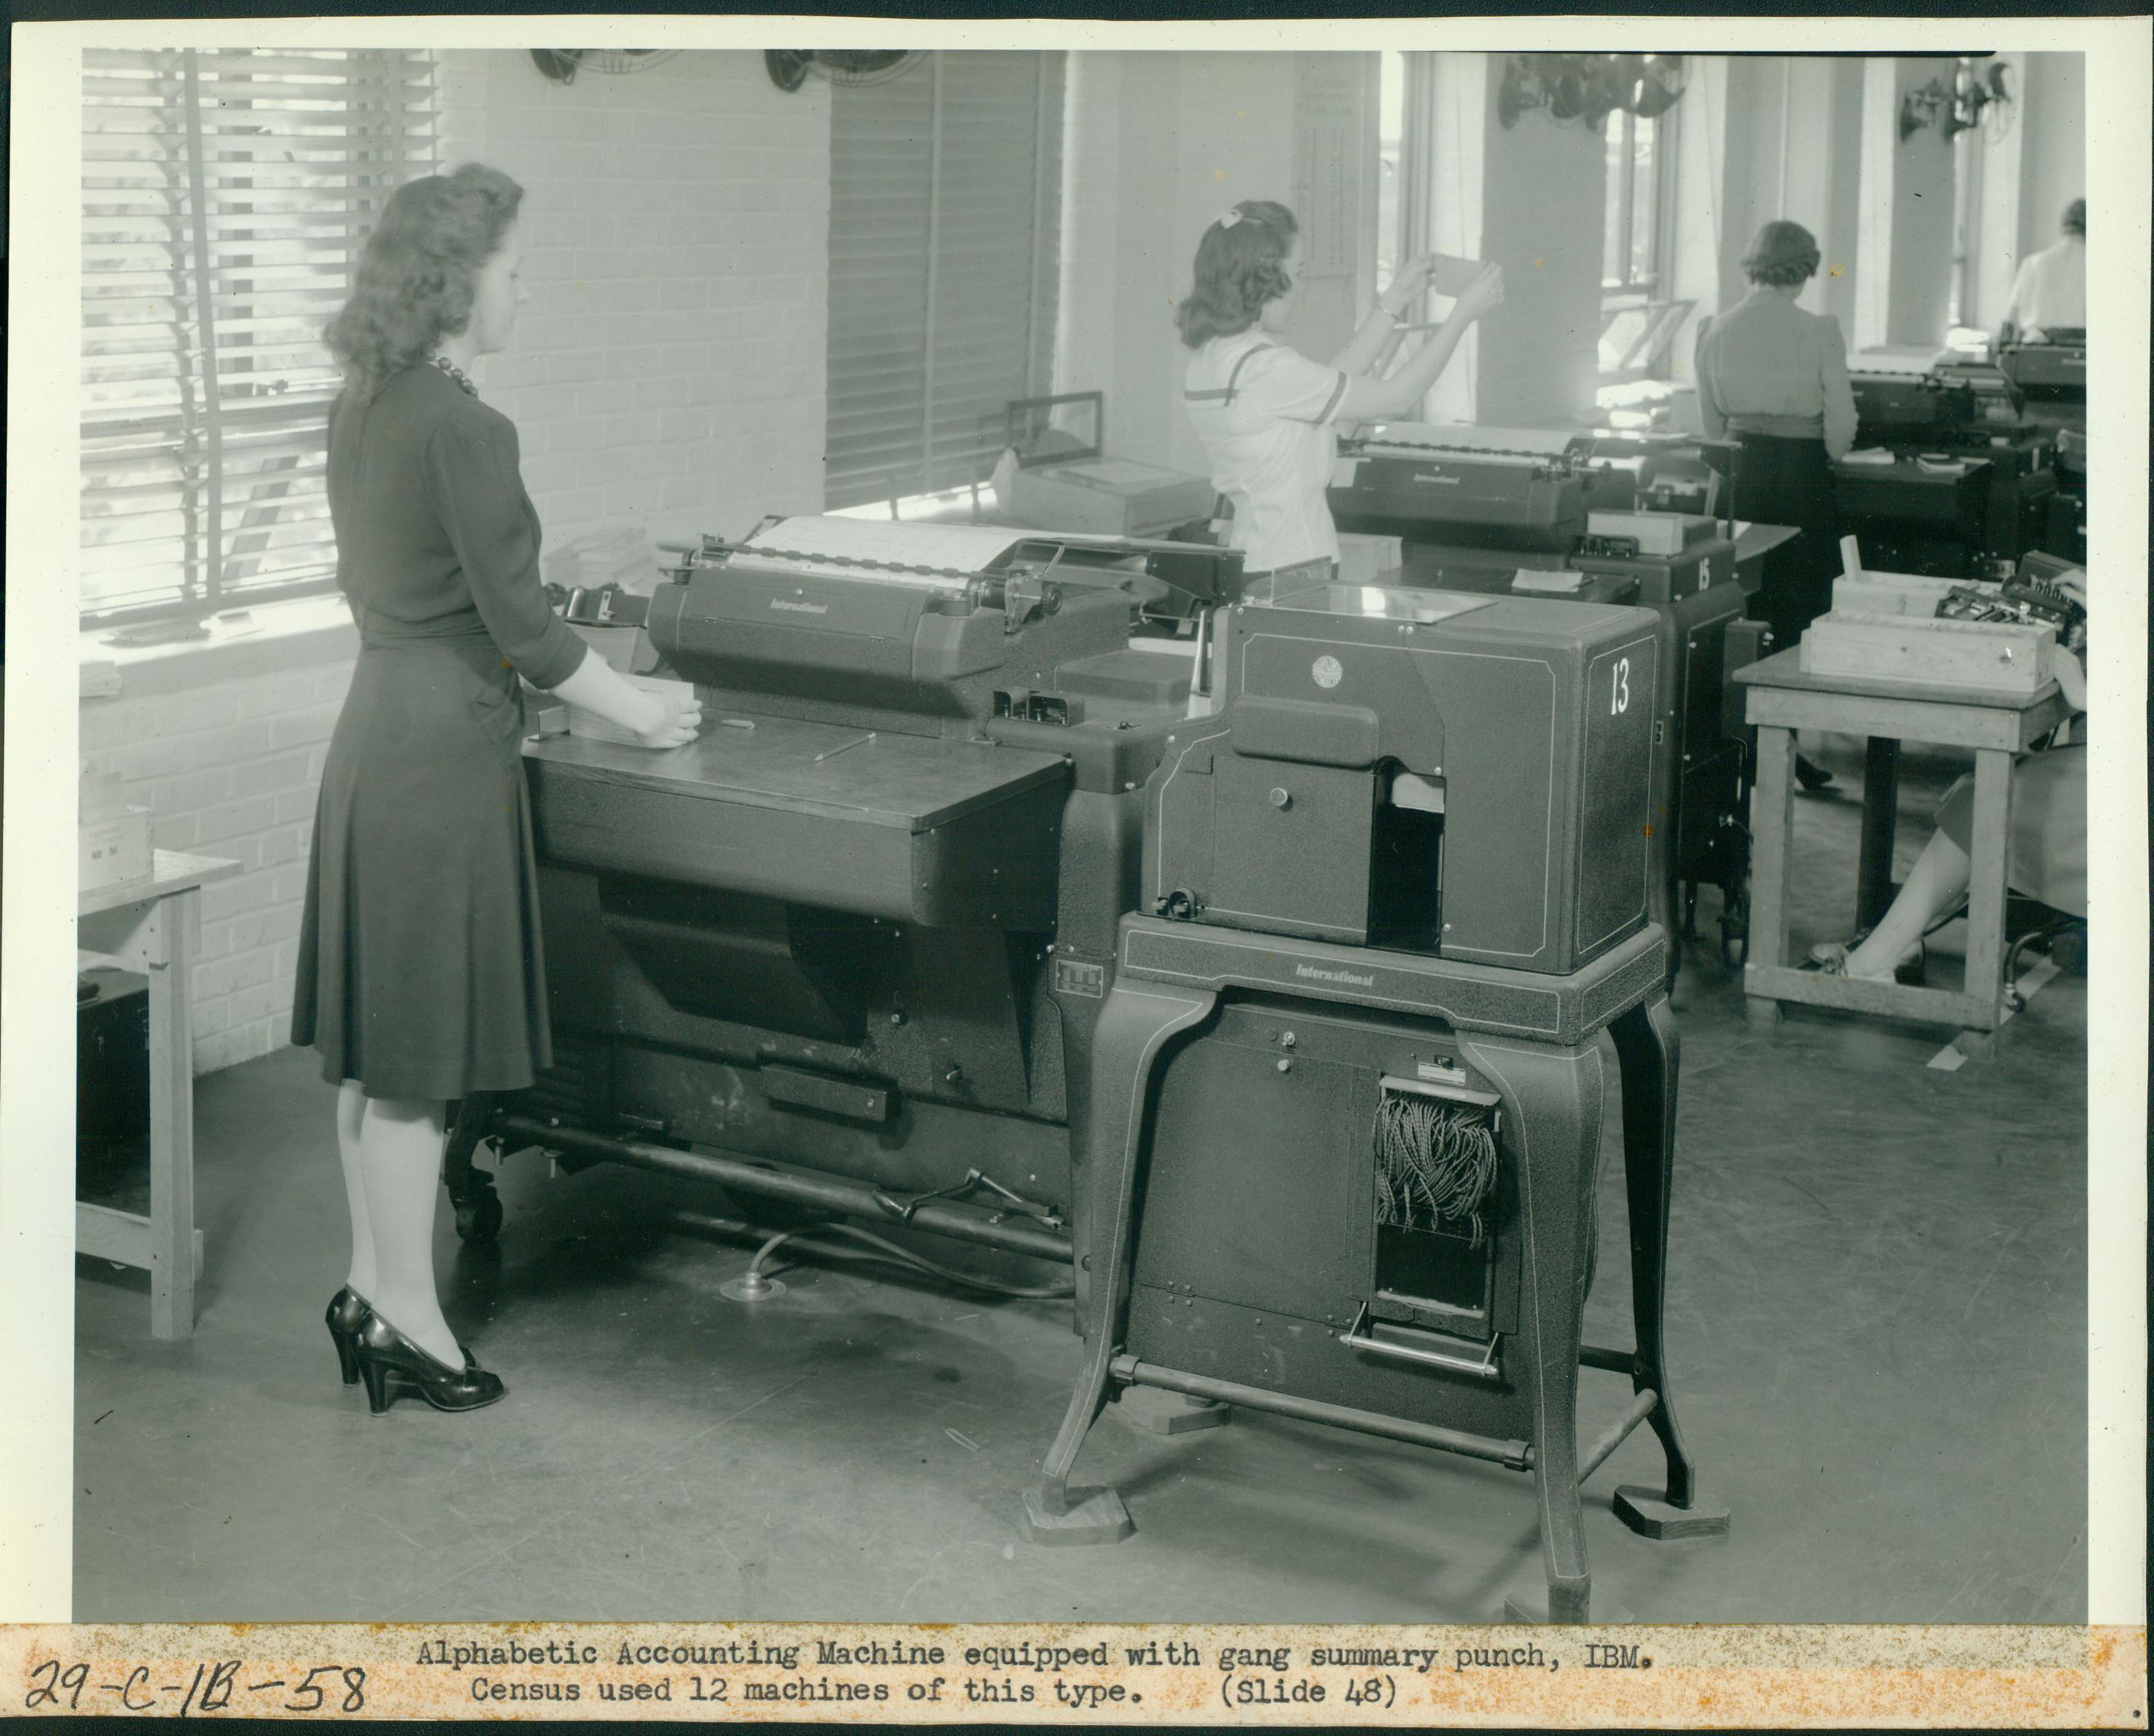
Or like this.
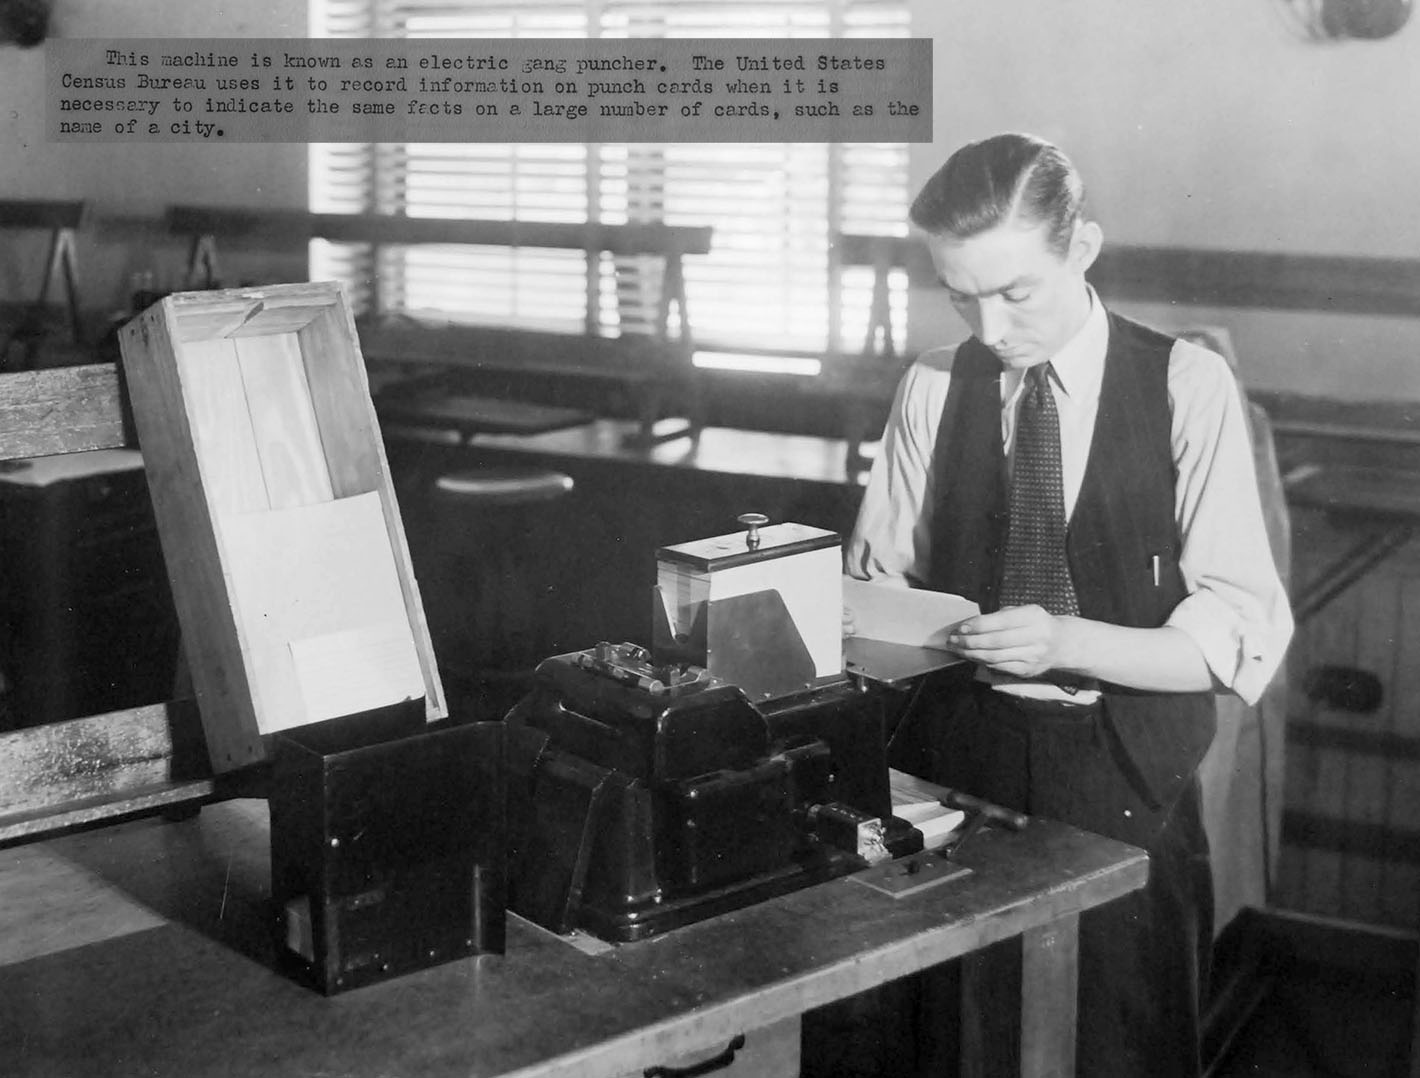
Or this.
The Census Bureau took (and takes) pride in its role as a pioneer in tabulating machinery. And for good reason: The census invented the punch card, preparing the way for the computer and information age. Inspired by the practice of punching tickets with information about a railroad journey, young Herman Hollerith realized that personal information could also be stored on a paper card. Once put on paper, cleverly designed machines could read their data and add it all up. The population of the United States had grown steadily, as had the desire of its people and its politicians for more and better data. Before Hollerith’s invention, the census bureau had reached the absurd point where it had not yet finished processing all of the previous census’s figures when the new one began. Mechanical sorters and tabulators, as well as the punch cards they fed upon, did more than make the census viable. They formed the basis for what would become IBM and then an entire industry.
In 1940, the Census Bureau’s mechanical laboratory continued to invent new machines and techniques. (The first photo above, for instance, is showing off a newer leaner tabulator literally being rolled out for the coming count.) In years to come, Bureau technicians developed optical mark recognition technologies (a cousin to the pencil-marking bubble forms that were to become the bain of generations of students and SAT-takers), as well as pre-GPS, nation-spanning digital maps. (If facebook is a Web 2.0 company, then the Census was Web 0.5.) Steven Ruggles and Diana L. Magnuson document these contributions and demonstrate their central place in the history of “Capturing the American People.” They also explain what was lost when, in the name of making the federal government leaner over the last four decades, in-house technical staff at the Census Bureau lost funding, leaving gaps to be filled (often poorly) by private (usually military) contractors. Their whole paper is worth reading.
Ruggles and Magnuson’s summary of the history of data capture in the census struck me as just right. They said what my work too, and the rest of the scholarly literature, led me to believe was true:
From 1850 to 1950, individual characteristics were transcribed in longhand on census forms, which then had to be centrally processed by hand. From 1850 to 1880, this hand processing was done by tally-marks; from 1890 to 1950, the forms were transcribed onto punch cards, so they could be tallied by machine. (33)
In the modern census, mechanical tabulation (using punch cards) took over for hand-written tallies. This is the standard story. And it’s true.
Kinda.
There is one exception. And it’s a doozy.
There remained one part of the system where people kept jotting down figures instead of punching cards. The simple tally of the American population, the one thing specifically required by the Constitution and responsible for allocating political power in the United States: that was done by hand the entire time.
This realization dawned on me as I admired this charismatic little diagram^, a gem buried in the archives of Calvert Dedrick, head of the 1940 Statistical Research Division:
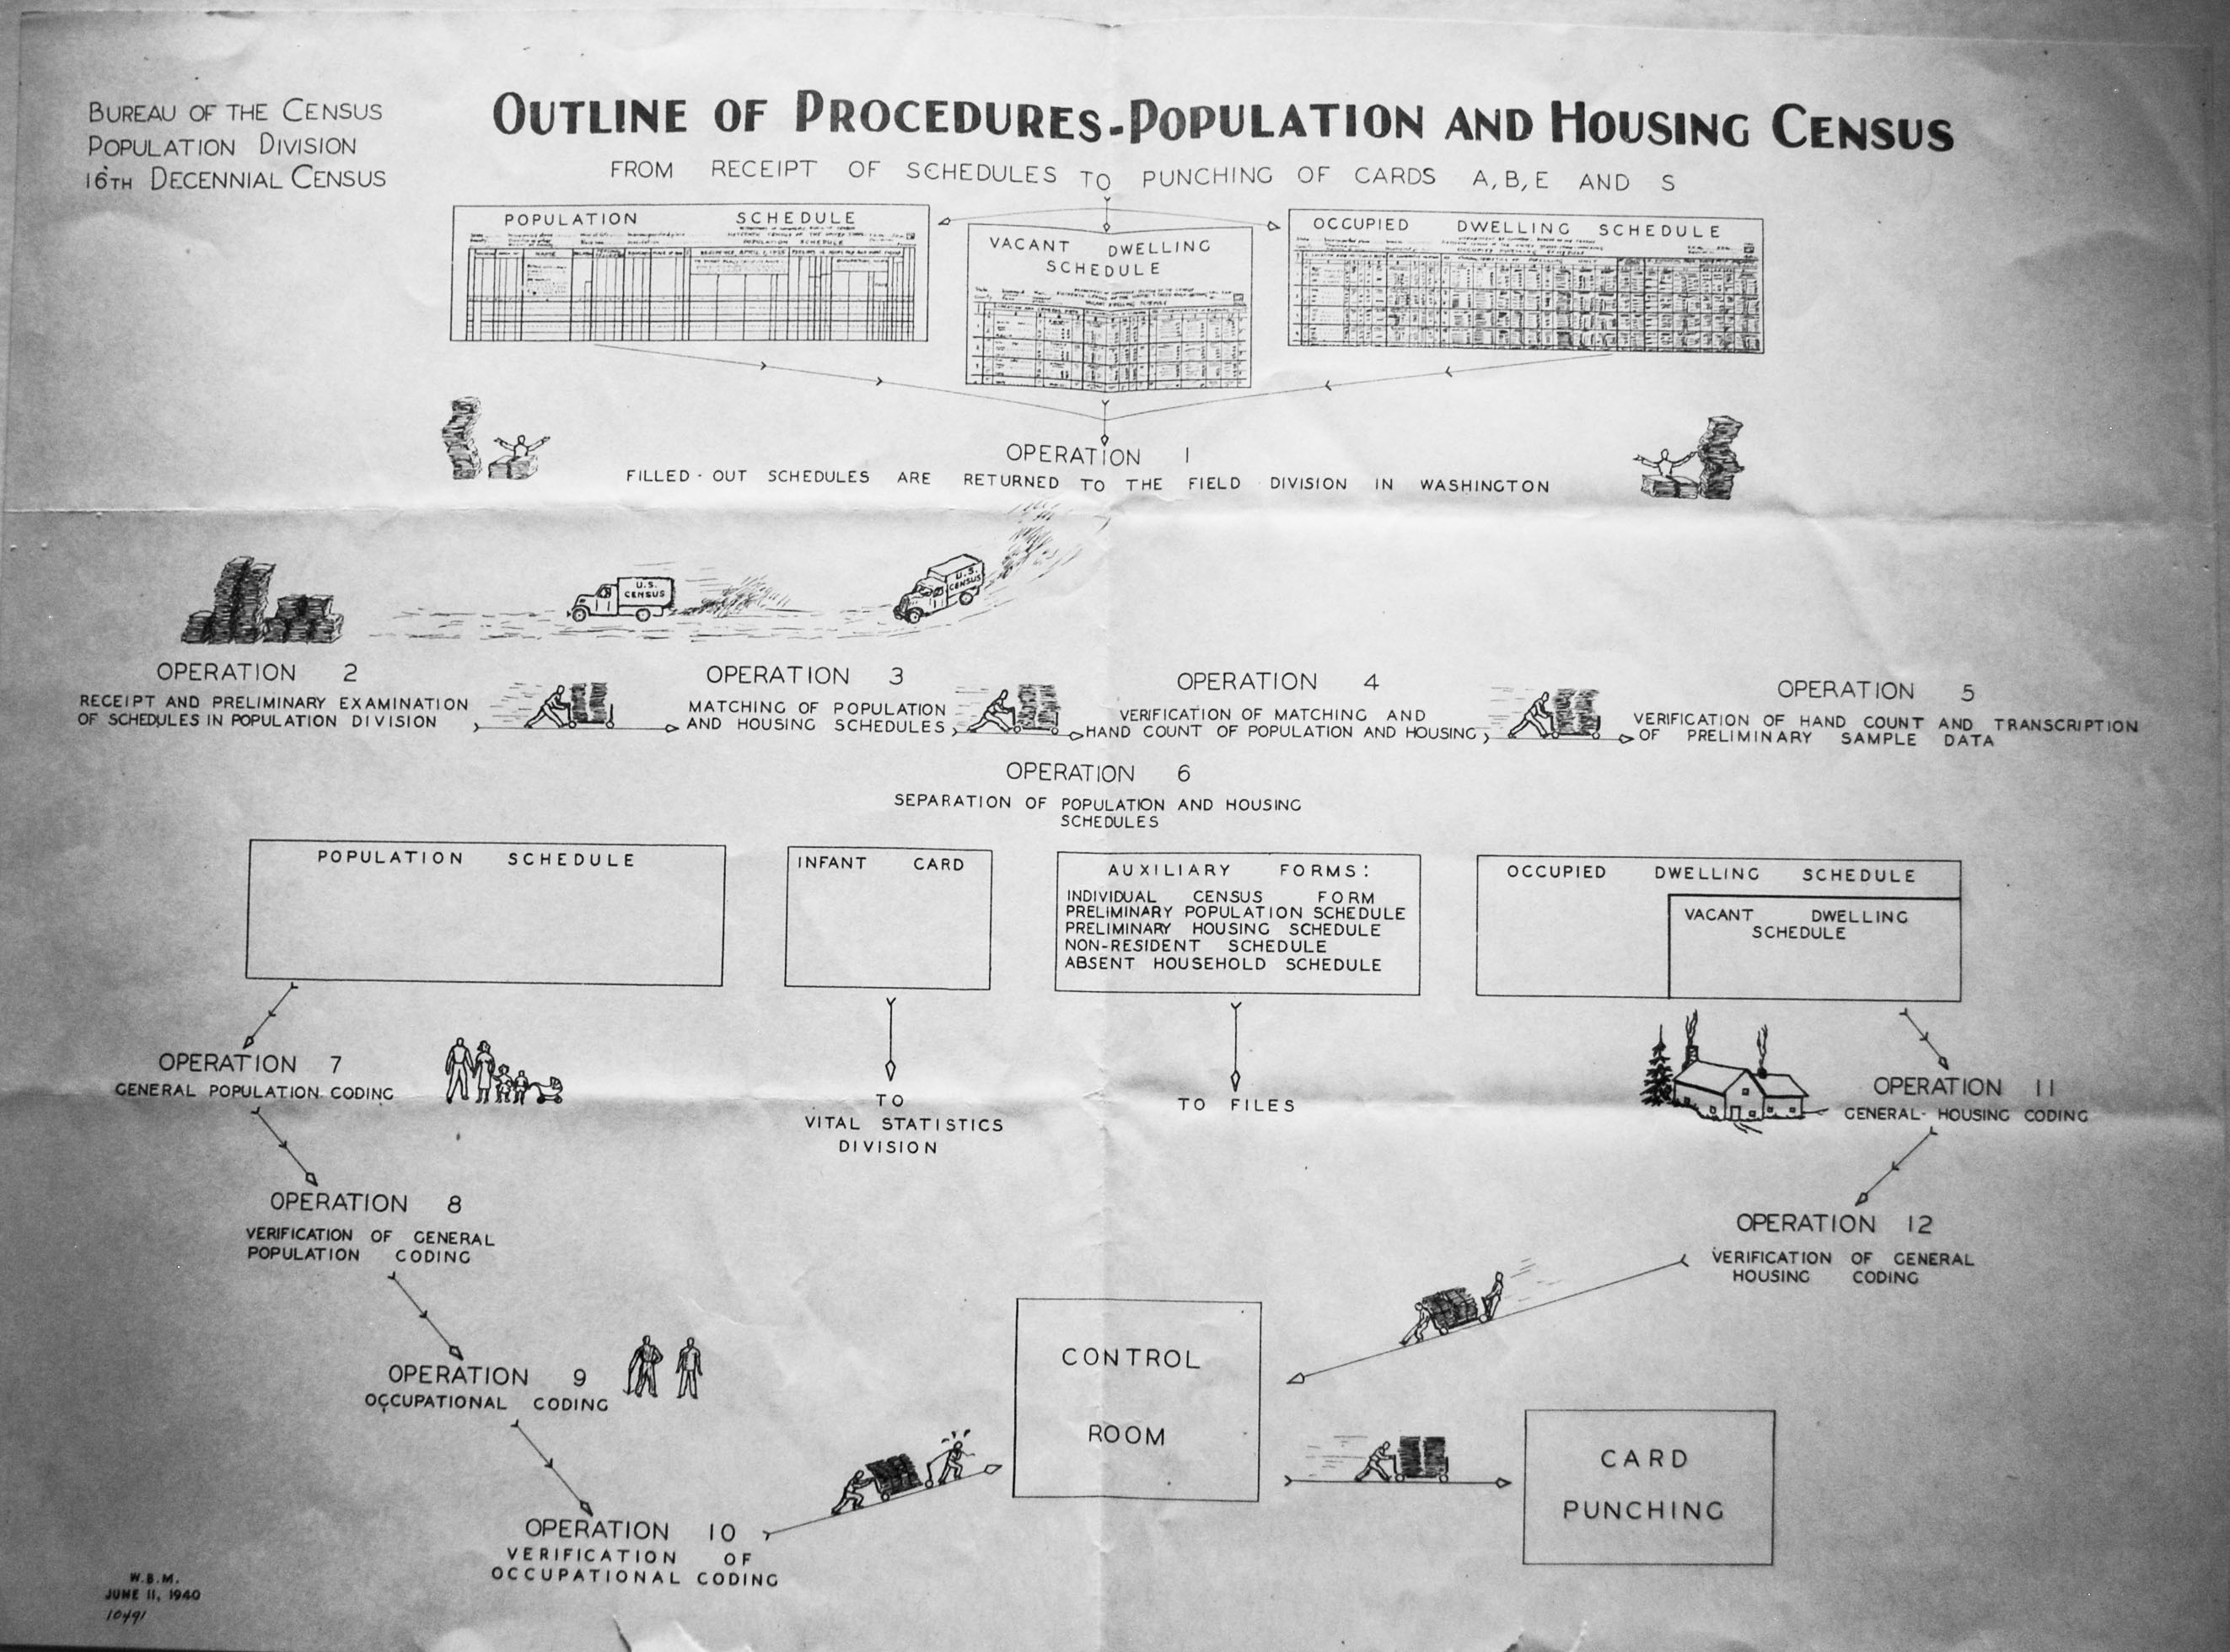
The diagram tells the story of a process: of how a person (or home) after being recorded on a census sheet in an enumerator’s portfolio goes on to become a punch card, or multiple punch cards. Every line on a census schedule represented an American. Each line eventually became a punch card. One of these:
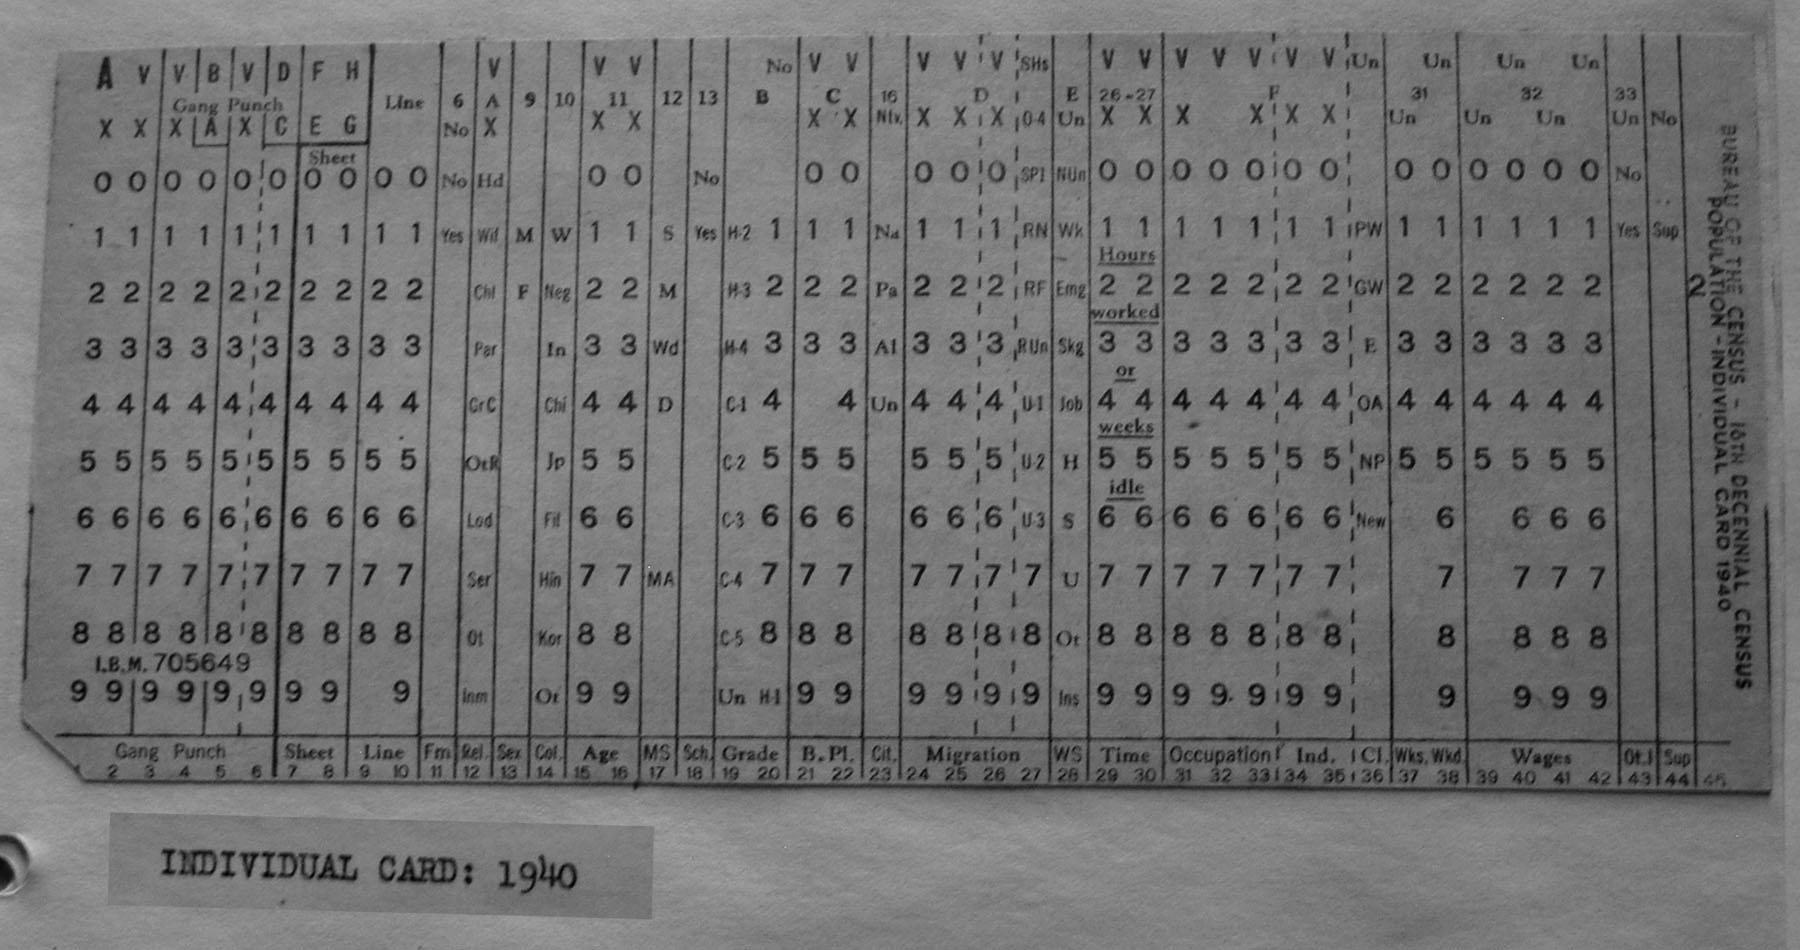
Card “A” (above) recorded a person’s information. (That means the Bureau had to print over 131 million such cards and punch each one.) Card A is one of the 4 cards listed as a chief product of the process displayed in the diagram.
I assumed that early in the tabulation process, machines counted all the Card “A”s together, and voila: population!
That was the story that fit with the fixation on computation in my social worlds. More to the point, it fit the fixation on machine tabulation that I saw throughout the archives.
For example, when I first read a 1940 guide for new Census Bureau employees (pasted into a 1940 scrapbook), I noticed how important all the high-tech gadgetry was to the story the Bureau told about itself. When new Census Bureau office employees were hired by the thousands to process all the data flowing around the country, they read that guide and would be forgiven for thinking that punch cards and tabulation were the point. The guide devoted only a couple sentences to humans doing stuff, to checking schedules for errors, “editing” them, and translating some responses into numerical codes. Then came three long paragraphs expounding the virtues of the Bureau’s “almost superhuman machines.” That section began: “The tabulation of the enormous mass of data assembled by the Bureau is made possible by the use of punched cards and electric tabulating equipment.” Maybe punch cards and tabulators were the point.
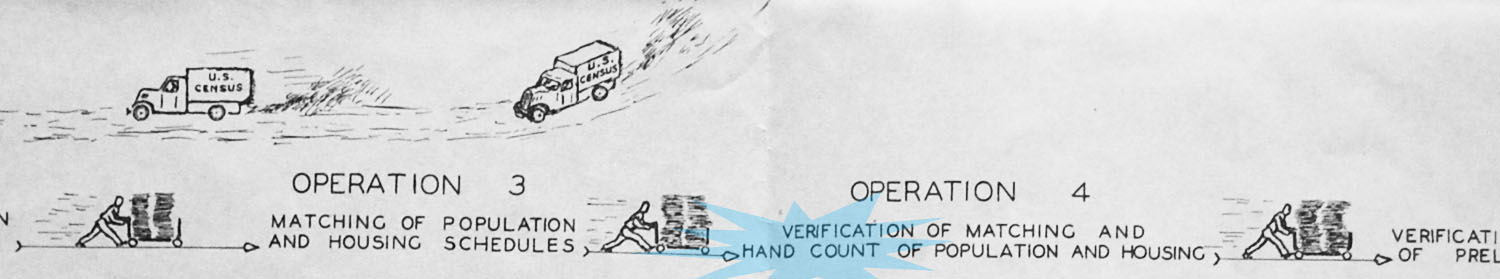
But as I studied this diagram, I saw new things. I got past the larger logic of the diagram, of a relentless push toward the making of punch cards. I also got past thinking: “gee whiz, it looks like so much fun, pushing around those laden trolleys or belching out diesel smoke in a speeding Census pickup truck;” and “golly, I bet whoever made this had a boring job that they insisted on making just a tad bit more fun.”^^ I got past all that and noticed an arrestingly strange phrase, in small lettering, slightly off from the center the diagram, in a place where it commanded absolutely zero extra attention: “Hand Count of Population and Housing.” It was hidden in plain sight.
I’ve highlighted it for you below:
Despite all that talk of mechanical tabulation, could it really be that the Census Bureau knew how many Americans there were before a single card was punched? Did they really count the entire population “by hand”? What would that even mean?
It turns out that the count really did happen “by hand.” And this wasn’t a secret accidentally disclosed by our doodling diagram-drawer. In fact, it’s right there on page 52 of one of my foundational references, the official procedural history of the count (pdf). It does not get any clearer cut that this:
“This hand count [in Operation 4] served as the official population count used in the apportionment process and was the basis for the first series of state bulletins on population and the first volume of the final population report.” (52)
So what does it mean to count by hand? I mean, no one has that many fingers. Right?!
Here’s what I’ve worked out: clerks assigned to Operation 4 combed through one enumeration district’s worth of data at a time, examining the housing and the population census sheets together, comparing one to the other. The clerk made sure the right sheets had been put together, did a variety of checks to be sure the right places had been surveyed in each, and went through “cancelling” any blank lines or lines containing a person who the enumerator indicated had been included in error. Then the clerk counted up all the lines that had any person’s name in it, counted all the cancelled lines, checked to be sure the sum added to 80 for each sheet, and wrote the total down.
According to the procedural history, Form P-113a controlled this operation. Sure enough: I found a copy of that form among all the other 1940 census forms stored in a comprehensive scrapbook. I’d seen this slip before, but hadn’t noticed it. I certainly never guessed it had Constitutional significance.
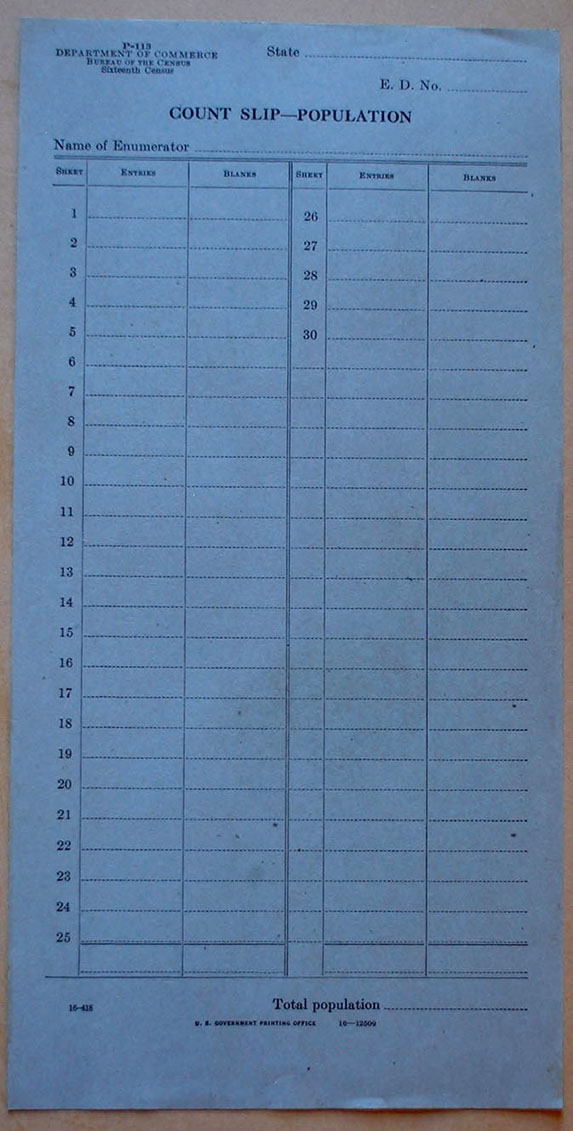
The Census Slip definitely lacks charisma. It had two simple columns: one for “entries” and one for “blanks.” (It only looks like there are four columns because the form’s designer wanted to allow for districts to have 30 or more sheets, but could only fit 25 top to bottom.) At the very bottom, the clerk wrote the district’s “total population,” which could be found by summing all the values in the “entries” column.
Once that was done, according to the procedural history, “The clerks were instructed to place the materials into the portfolio in the same order in which they had been received and to attach both count slips to the outside of the portfolio, enter the required information on the portfolio memorandum, and return the portfolio to the section chief.” (36)
All those slips, clipped to their respective portfolios, made their way to still more clerks. They were pushed around on carts if our diagram drawer is to be believed.
In Operation 6 “all count slips were removed from the portfolio and placed in a manila envelope. Count slips of E.D.’s in the county or city were also placed in the envelope. The state name and the county symbol were entered on the outside of the envelope.” (39)
Somewhere along the way, someone added up all the totals at the bottom of each P-113 form for each state and for the United States as a whole. Maybe those calculations took place in a room like this one:
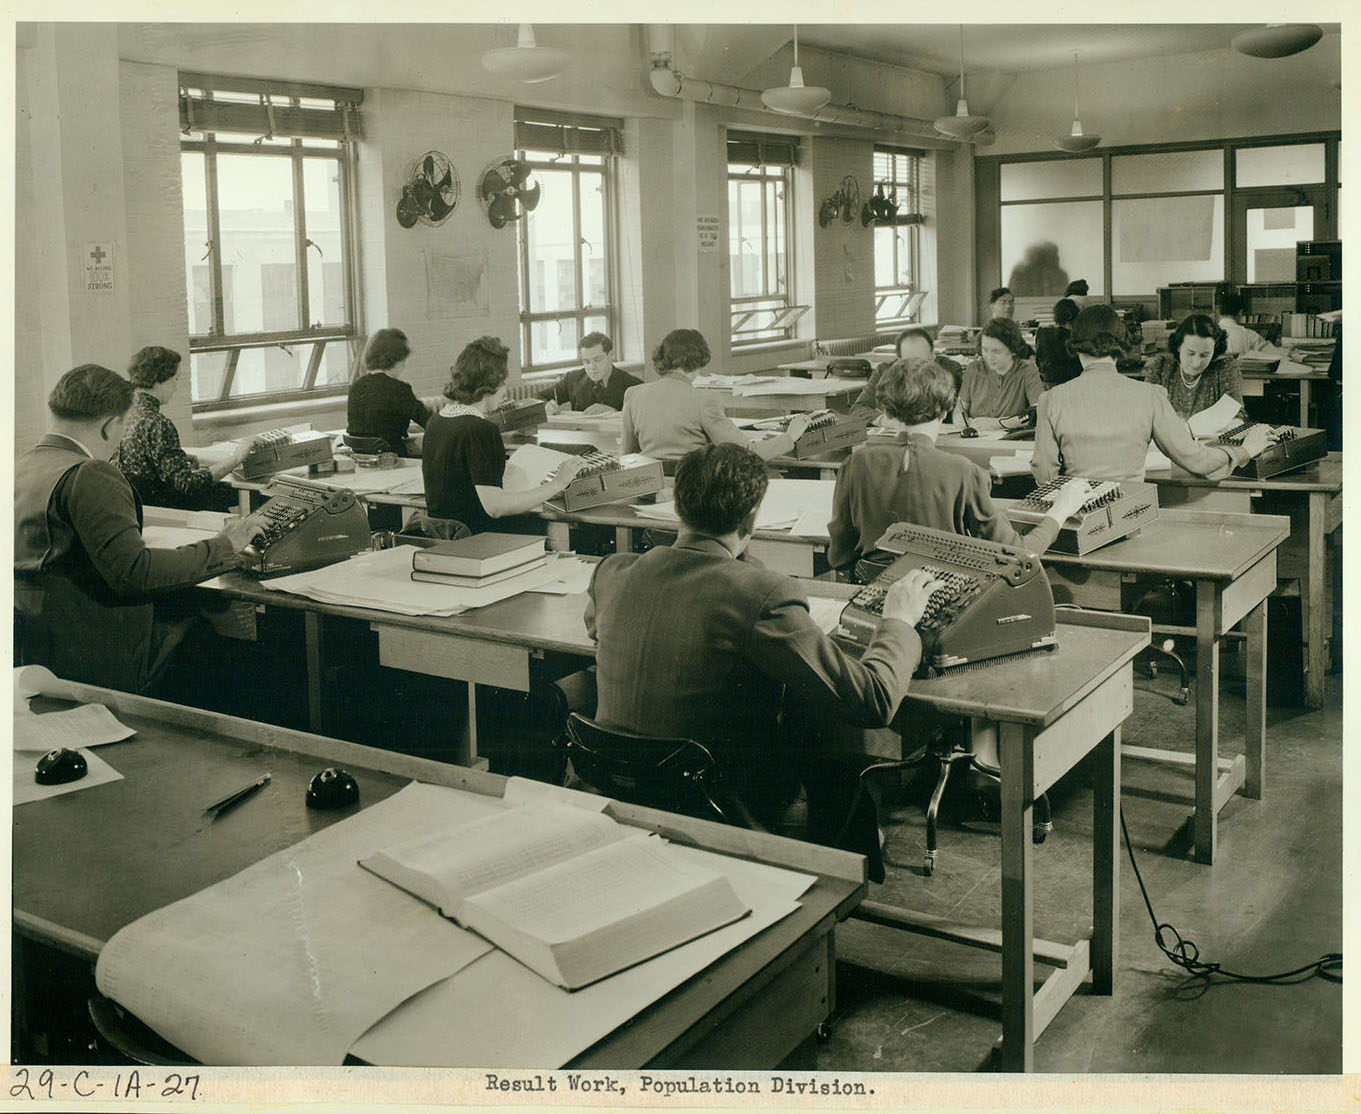
I expect whoever did that work had the help of a mechanical calculator, but I’ve found no mention one way or the other about how precisely the hand counts become one, definitive population count. This, though, I now feel confident to assert: no punch cards were harmed in the making of the American population totals.
^You didn’t think a diagram could be charismatic, did you? But just look at those little people pushing their cart around? I’m riffing here on the idea of “charismatic megafauna”: the elephants and pandas and whales of the world, with their big features and big eyes, which more readily win the affection and concern of large (human) publics when they are threatened by environmental catastrophes (caused by humans). In contrast, who weeps for the salamanders or invertebrates driven to extinction? In this metaphor, ordinary census forms (like P-113 above) are the salamanders, and this diagram is the panda.
^^Today, this person would be one of those who makes the Google doodles.